


İstanbul Gelişim Üniversitesi (İGÜ), uluslararası akreditasyon süreçlerinde önemli adımlar atmaya devam ediyor. Türkiye’nin en fazla uluslararası akredite programa sahip üniversitesi olan İGÜ, Kasım ve Aralık 2024 tarihleri arasında birçok prestijli akreditasyon kuruluşunun değerlendirme ve yenileme ziyaretlerine ev sahipliği yaptı. Bu süreçler, üniversitenin uluslararası standartlarda eğitim kalitesine olan bağlılığını bir kez daha gözler önüne serdi.
“UI GreenMetric Dünya Üniversite Sıralaması 2024” sonuçları açıklandı. Çevresel sürdürülebilirlik çalışmalarıyla dikkat çeken İstanbul Gelişim Üniversitesi (İGÜ), önceki yıllardaki yükselişini sürdürerek önemli bir başarıya daha imza attı. İlk kez 2022 yılında GreenMetric sıralamasına giren İGÜ, bu yıl 435 puanlık artışla toplam 6070 puan elde ederek dünya sıralamasında 677’nci sırada yer aldı. Türkiye genelinde tüm üniversiteler arasında 70’inci olan İGÜ, Türkiye’deki vakıf üniversiteleri arasında ise 15’inci sırada derecelendirildi.
Türkiye’nin en fazla uluslararası akreditasyona sahip üniversitesi olan İstanbul Gelişim Üniversitesi’nde, İktisadi, İdari ve Sosyal Bilimler Fakültesi’nin bölümlerinin uluslararası akreditasyon süreçlerinin görüşülmesi ve yenilenmesi kapsamında Uluslararası Bağımsız Akreditasyon Kuruluşu, Avrupa Kalite Güvencesi Birliği üyesi AQAS yetkileri ile 10-12 Aralık tarihleri arasında toplantı gerçekleştirildi.
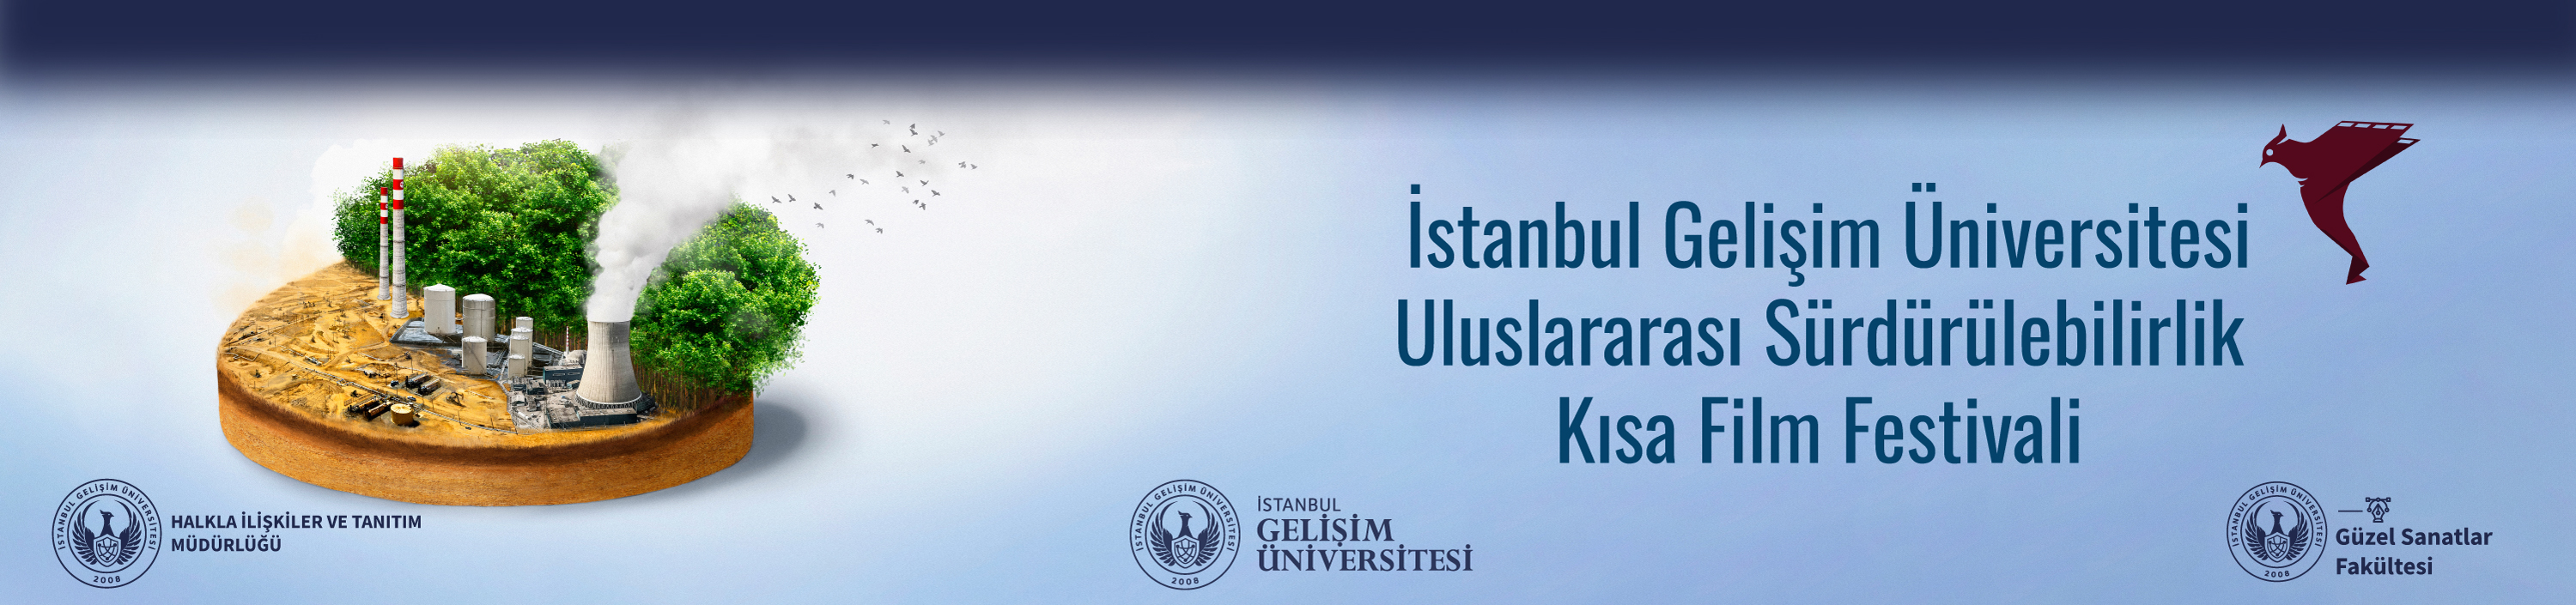
İstanbul Gelişim Üniversitesi, Halkla İlişkiler ve Tanıtım Müdürlüğü ve Güzel Sanatlar Fakültesi iş birliğiyle ilk kez düzenlenen Uluslararası Sürdürülebilirlik Kısa Film Festivali başladı. Dünya çapında genç sinemacılara kendilerini ifade edebilmeleri için önemli bir fırsat sunan festivalde, saygı duruşu ve İstiklal Marşının ardından İstanbul Gelişim Üniversitesi (İGÜ) Mütevelli Heyeti Başkanı Abdulkadir Gayretli ve Festival Direktörü, İstanbul Gelişim Üniversitesi Kurumsal İletişim ve Tanıtım Daire Başkan Yardımcısı Öğretim Üyesi Ahmet Bikiç tarafından açılış konuşması gerçekleşti.
Mühendislik fakültelerini değerlendiren, kâr amacı gütmeyen ve bağımsız bir sivil toplum kuruluşu olan ABD merkezli "Accreditation Board for Engineering and Technology" (ABET) Komitesi, 15-19 Kasım 2024 tarihleri arasında akademik programların uluslararası akreditasyonlarının yenilenmesi çalışmaları kapsamında İstanbul Gelişim Üniversitesi'ni ziyaret etti.
İstanbul Gelişim Üniversitesi, Halkla İlişkiler ve Tanıtım Müdürlüğü ve Güzel Sanatlar Fakültesi iş birliğiyle ilk kez düzenleyeceği Uluslararası Sürdürülebilir Kısa Film Festivali ile dünya çapında genç sinemacılara kendilerini ifade edebilmeleri için önemli bir fırsat sunuyor. 27-29 Kasım 2024 tarihleri arasında gerçekleşecek olan festival, Birleşmiş Milletler’in sürdürülebilir kalkınma hedeflerine odaklanarak çevre bilincini ve sosyal sorumluluğu sinema aracılığıyla vurgulamayı hedefliyor.
Avrupa Birliği’nin desteklediği Gençlerin Örgütsel Liderliği (Youth Organizational Leadership - YOL) isimli proje kapsamında Afyonkarahisar Kendin Yap Derneği yürütücülüğünde bir araya gelen genç liderler, İstanbul Gelişim Üniversitesi (İGÜ) Rektörü Prof. Dr. Bahri Şahin’i makamında ziyaret etti.
Son günlerde hem üretimi hem de tüketimi hızla yaygınlaşan Dubai çikolatası, sık tüketildiğinde birçok sağlık sorununu da beraberinde getiriyor. Dubai çikolatasının zararlarını ve insan sağlığını tehdit eden yönlerini Beslenme ve Diyetetik Uzmanı Dr. Öğr. Üyesi Merve Bayram açıkladı.
İstanbul Gelişim Üniversitesi’nin CyberShield Innovators projesi, Avrupa İnovasyon ve Teknoloji Enstitüsü’nün (EIT) Deep Tech Talent Initiative kapsamında 2024 Eğitim Teklif Çağrısı'nın kazananları arasında yer aldı. EIT Deep Tech Talent Initiative, bir EIT projesi olup, Avrupa Komisyonu tarafından finanse ediliyor.
Sağlık ve Sosyal Bilimler alanında çeşitli eğitim programlarının akreditasyon çalışmalarını yürüterek eğitim kalitesinin yükseltilmesini amaçlayan Accreditation Agency in Health and Social Sciences (AHPGS) Alman Akreditasyon Kurumu 10-12 Kasım 2024 tarihleri arasında Sağlık Bilimleri Fakültesi (SBF) akademik programlarının uluslararası akreditasyon süreçlerinin görüşülmesi ve yenilenmesi kapsamında İstanbul Gelişim Üniversitesi’ni ziyaret etti.
.jpg)