7.2.3. Carbon Reduction and Emission Reduction Process
IGU, aware of its institutional responsibility in combating global climate change, adopts a holistic approach to reducing carbon emissions. Within this framework, the university regularly monitors carbon emissions resulting from energy consumption, conducts annual carbon footprint calculations in accordance with international standards, and sets strategic improvement targets based on the data obtained. To minimize emissions from electricity, natural gas, and fuel use, the university undertakes both technical infrastructure investments and awareness-raising initiatives aimed at transforming user behaviors. All these efforts enable the university to structure its carbon management and emission reduction processes—one of the fundamental components of its sustainability policy—in a systematic, transparent, and measurable manner.
The 2024–2028 Strategic Plan includes strategic objectives, targets, and indicators aligned with this direction. The relevant objectives, targets, and indicators are as follows:
SA.3. Enhancing multifaceted social benefit by centering sustainability
-
SH.3.1. Increasing the quality and quantity of social responsibility projects.
-
SH.3.2. Enhancing the effectiveness of the sustainable environmental management system.
-
SH.3.3. Elevating the level of cooperation with local and regional institutions and organizations.
-
SH.3.4. Increasing activities aimed at serving the community.
Relevant Indicators:
-
Electricity consumption (kWh)
-
Capacity of renewable energy sources (kWh)
-
Investment in energy efficiency (USD)
-
Ratio of total Zero Emission Vehicles (ZEV) to total campus population
The use of automation systems and LED lighting indirectly supports IGU’s objectives by reducing energy consumption. Regular training sessions are organized to raise awareness among students and staff about carbon emissions. Efforts to reduce the carbon footprint include implementing conservation measures in water, electricity, heating, and transportation. Additionally, environmentally friendly, energy-saving, and low carbon-emission air conditioners and devices are prioritized in procurement processes. To ensure efficiency and prevent energy waste, maintenance is regularly performed on all devices at scheduled intervals.
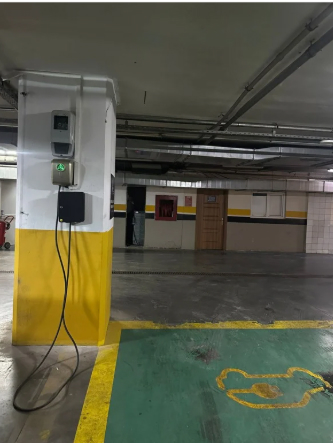
In line with its low-carbon transportation systems, IGU took a significant step on July 5, 2024, by adding a zero-emission vehicle to its fleet. With this addition, the total number of zero-emission vehicles at the university has increased to two. Furthermore, to support environmentally friendly transportation infrastructure, an electric vehicle charging station has been installed in the university parking lot. A specialized measurement device has also been integrated into the system to monitor the performance and safety levels of the equipment used at the charging station. All these implementations clearly demonstrate IGU’s institutional commitment to supporting the transition to low-carbon technologies and promoting sustainable energy use.
Click here.
Projects aimed at the reuse of rainwater and greywater are being developed to promote savings and raise awareness. One such rainwater reuse project has been implemented at the Tower Campus, with plans to extend it to other buildings. To further reduce the university’s carbon footprint and ensure sustainability, training programs intended to raise awareness about factors affecting the carbon footprint are planned.
The university’s institutional commitment in this area has also been validated by the University Monitoring and Evaluation General Report-2024 prepared by the Council of Higher Education (YÖK). In the report, IGU ranked first in Turkey in the categories of “energy efficiency investment” and “investment in water savings per unit of water consumed,” while also placing among the top 10 in the “per capita direct carbon footprint” indicator. These achievements demonstrate the university’s national-level dedication to the sustainable use of natural resources and its tangible contributions to carbon reduction efforts.
The studies conducted in this context are listed below:
1. The use of fluorescent lamps on campuses has been gradually reduced year by year. These fluorescent lamps are being replaced with longer-lasting and more energy-efficient LED lighting. This initiative not only decreases consumption but also reduces the number of lamps, resulting in higher illumination levels at a lower cost, thus increasing efficiency. In 2024, in line with this plan, 2.298 fluorescent lamps in use areas were replaced with 2.298 LED lamps. As a result, the LED lighting rate improved from 78,49% to 90,08%. This effort will continue in 2025.
2. Regular maintenance and system renewal efforts are ongoing to improve the energy efficiency of mechanical automation systems at the university's Tower Campus. Within this scope, one of the priority goals for 2025 is to replace the existing chillers—responsible for high energy consumption—with new-generation units that offer lower carbon emissions and higher efficiency. This improvement will contribute to reducing energy consumption across the campus and, consequently, decrease the university’s carbon footprint.
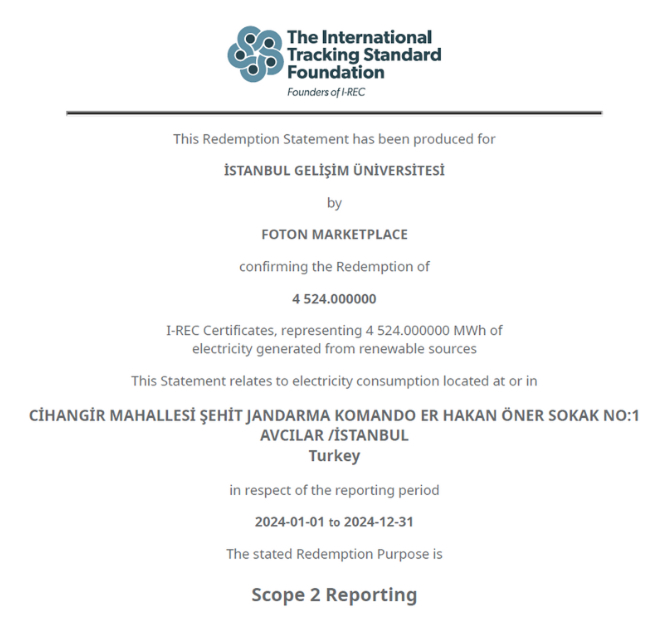
3. In line with its strategic energy policies aimed at reducing carbon emissions, IGU has adopted the use of renewable energy sources in its energy supply as a corporate priority. Since 2021, all electricity consumed across the university has been sourced from renewable energy generated by hydroelectric power plants; as of 2024, IGU’s entire electricity consumption is met by solar energy. This transition has been officially certified through the Renewable Energy Guarantee of Origin System (YEK-G) and the internationally recognized International Renewable Energy Certificate (I-REC). IGU’s approach to utilizing renewable sources in its energy procurement process aims to minimize environmental impacts. Through these practices, reductions are achieved not only in direct carbon emissions related to energy consumption but also in the university’s indirect environmental footprint.
Furthermore, IGU approaches this process not as a static measure but as a dynamic and evolving sustainability strategy; it seeks to strengthen emission reduction efforts through multifaceted interventions such as investments in energy efficiency, digital monitoring systems, green building applications, and integration of low-carbon technologies. Within this framework, the university not only reduces its current carbon emissions but also shapes carbon management plans for future years.
4. Lighting systems at the Tower Campus have been upgraded with daylight sensors to control illumination, ensuring that lights automatically turn off after working hours. This aims to prevent unnecessary electricity consumption.
5. Policies promoting the use of renewable energy sources, specifically wind and solar energy, have been enhanced.
6. Work on a 4 MW solar power plant (GES) project is ongoing. The site has been selected and official procedures have commenced, with the plant scheduled to become operational in 2026. IGU’s objective is to meet its own energy consumption through its power plant.
7. The use of various electrical appliances such as tea and coffee machines in staff offices increases energy consumption. To reduce energy use, efforts to establish shared kitchen areas on campuses are underway. Accordingly, three kitchens have been established at the Tower Campus.
8. Annual tree planting and afforestation activities continue regularly as part of efforts to reduce the carbon footprint.
9. Procurement processes for new equipment to be used on campuses continue to adhere to purchasing specifications that prioritize energy efficiency as the primary selection criterion.
10. Regular maintenance is conducted on compensation panels used to prevent losses affecting total energy consumption.
11. Throughout 2024, plant-based waste oil management activities have been effectively carried out in alignment with environmental sustainability targets.
12. In line with its environmental sustainability policies, IGU does not limit its carbon emission reduction efforts to energy consumption alone but follows a comprehensive strategy incorporating waste management, recycling practices, and circular economy approaches. Within this framework, hazardous and harmful wastes originating primarily from gastronomy kitchens, laboratories, clinics, and technical units are strictly controlled in full compliance with environmental regulations. These wastes are segregated, temporarily stored under appropriate conditions, and disposed of through licensed firms.
Throughout the year 2024, the following waste management processes were systematically carried out:
Vegetable waste oil management was implemented consistently in the gastronomy kitchens located in Blocks B, C, and G of the university. A total of 380 kg of waste oil was collected and handed over to a licensed recycling company, thereby preventing contamination of the sewage system, damage to groundwater, and carbon emissions released into the atmosphere.
Through grease trap systems, 603 kg of mixed waste consisting of oil and grease was collected, processed under the relevant waste code (19 09 10), and sent for disposal.
Toner and cartridge wastes were separately collected across the university, with 55 kg of toner waste delivered to a licensed firm in 2024.
A total of 696 kg of liquid chemical waste generated from laboratory and clinical activities was labeled in compliance with applicable regulations and safely disposed of.
Packaging waste contaminated with chemicals, amounting to 160 kg, was collected with proper classification and waste codes, then handed over to licensed firms.
Hazardous pharmaceutical waste was recorded as 150 kg and appropriately disposed of.
Additionally, 290 kg of motor oil from generators used throughout the university was collected without environmental harm and sent for disposal.
As a result of these efforts, a total of 1.954 kg of hazardous waste was collected and disposed of in accordance with environmental legislation within Istanbul Gelişim University in 2024.
All waste management processes are conducted integrally with the “Zero Waste” approach; operations are documented with official certificates and receipts, and environmental impacts are monitored continuously throughout the year.
The targets set for the year 2025 include:
-
Making the segregation of hazardous waste types more systematic,
-
Improving the infrastructure of temporary storage areas,
-
Enhancing the awareness and competencies of responsible personnel,
-
Establishing an integrated hazardous waste management mechanism aligned with the Zero Waste Management System.
These practices directly contribute to the university’s goals of reducing carbon emissions, preventing waste from entering the natural environment, supporting the carbon cycle through energy recovery, and leaving a livable environment for future generations.
7.2.3.1. Carbon Footprint Measurement Process and Method
Since 2018, Istanbul Gelisim University (IGU) has been regularly conducting primary carbon footprint calculations to shape its strategies aimed at reducing carbon emissions. In this process, annual data on the consumption of fossil fuels such as electricity, natural gas, gasoline, and diesel used across the university are collected and analyzed in accordance with international standards.
The primary carbon footprint has been calculated using the Intergovernmental Panel on Climate Change (IPCC) calculation methodology. Accordingly, the university’s carbon footprint caused by electricity consumption, transportation, and heating has been determined. Since carbon dioxide emissions are directly related to fuel combustion, their calculation is straightforward. Calculating other greenhouse gases requires multiple criteria. The IPCC calculation methodology consists of three categories under the term Tier. The Tier 1 approach has been used in this report. For this approach:
1.Official university records of gasoline, diesel, LPG, natural gas, and electricity consumption amounts have been obtained. For calculating emissions resulting from electricity consumption, the IPCC carbon dioxide emission factor of 0.584 ton/mWh, as stated in the master's thesis by Toröz (2015: 79), has been applied.
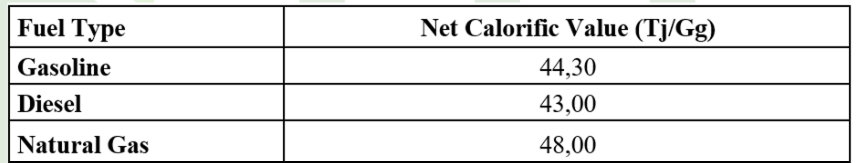
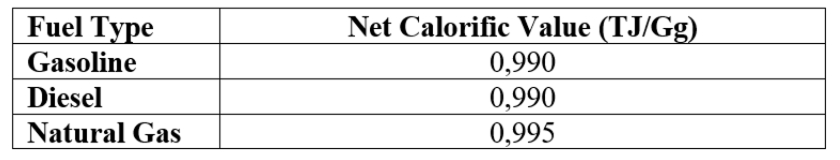
2.The consumption values of fuels are multiplied by the conversion factors provided in the IPCC guidelines to calculate the energy content. These conversion factors are those specified in the Regulation on Monitoring and Reporting of Greenhouse Gas Emissions, published in the Official Gazette dated 22.07.2014 and numbered 29068, and they comply with the values indicated in the IPCC 2006 guidelines. These values are given in Table 3.
Table 3. Net Calorific Value of Fuels (Source: ÇŞB, 2014:40)
Energy Consumption (TJ) = Fuel Consumption (t)× Net Calorie Value (TJ/Gg)
3. For each fuel group that is specified in the IPCC guidelines the carbon emission factors are selected and the total carbon content of the fuel is calculated using this value.
Carbon Content (t C) = Carbon Emission Factor (t C/TJ) × Energy Consumption (TJ)
Table 4: Emission Factor Of Fuels (Source: TUIK, 2013:16)

4. The amount of carbon that is not oxidized during combustion is found and the value of the carbon involved in complete combustion is calculated.
Carbon Emission (Gg C) = Carbon Content (Gg C) × Carbon Oxidation Rate
Table 5: Oxidation Rate Of Fuels (Source: ÇŞB, 2014:40)
5. At this stage, the ratio 44/12, which is the ratio of the molecular weight of CO₂ to the molecular weight of carbon, is multiplied by the value found in the previous step to find the CO₂ emission value resulting from the combustion of the fuel.
CO₂ Emission (Gg CO₂) = Carbon Emission (Gg C) × (44/12)
7.2.3.2. Carbon Footprint Calculation Result
Using the consumption data of gasoline, diesel, natural gas, and electricity for the year 2024, primary carbon footprint calculations for IGU have been conducted. The calculation was performed based on the IPCC Tier 1 approach, taking into account the relevant conversion factors and emission coefficients for each energy type.
Within this scope, the university’s carbon dioxide emission values from different sources are detailed in the table below. These data not only reveal IGU’s current carbon emission levels but also serve as a guiding reference for planning sustainability strategies for the coming years.
Table 6. Carbon Footprint Calculation of IGU (2024)
When examining the table, IGU’s total carbon footprint for the year 2024 is calculated as 3.095,976 tons of CO₂. Of this total, 85,33% originates from electricity consumption, followed by natural gas at 11,92%, diesel at 2,17%, and gasoline at 0,58%.
The comparative carbon footprint values by year are presented as follows. Although an increase in total emissions was observed in 2024 compared to 2023, this rise is due to the expansion of the university's physical footprint, including the commissioning of new laboratories, classrooms, and administrative areas, which led to increased electricity and natural gas consumption. The main reasons for the increase in natural gas consumption compared to 2023 can be listed as follows: boilers being operated regardless of outside temperature, weekend events and training held in the blocks, heating systems being activated one month earlier than in 2023, and the addition of radiators and central heating units. To reduce natural gas consumption, measures such as operating boilers with automatic control based on outside air temperature and installing hydraulic door closers on classroom doors to prevent heat loss are planned.
On the other hand, as a result of the university’s measures aligned with sustainable transportation goals, gasoline consumption decreased. Gasoline consumption, which was 10.600,32 liters in 2023, dropped to 7.692 liters in 2024, and accordingly, the carbon emissions from this source also decreased. This development demonstrates that awareness and practices aimed at reducing carbon emissions are being effectively implemented, highlighting IGU’s commitment to environmental sustainability.
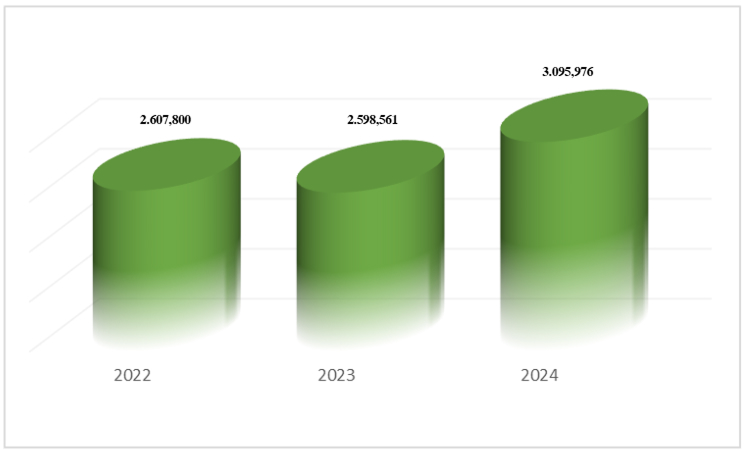
Figure 2. Carbon Footprint by Year (Tons of CO2)
Digital Carbon Emission and Energy Monitoring System
As of 2024, the university has developed a digital system for monitoring carbon footprint and energy consumption. The system enables server-based data collection and allows for the reporting of CO₂ emissions on an hourly, daily, monthly, and annual basis.
Currently, one server’s carbon emission is being monitored within the pilot phase, and by 2025, the system will cover all servers, allowing energy consumption and carbon emissions to be tracked digitally and in real time across the institution. This advancement ensures that energy efficiency, consumption reduction, and carbon management processes can be continuously monitored through data-driven, digital tracking mechanisms.
(The image below shows the hourly, daily, and monthly energy consumption (kWh) and CO₂e emission values (kW) of one server located in Block A.)
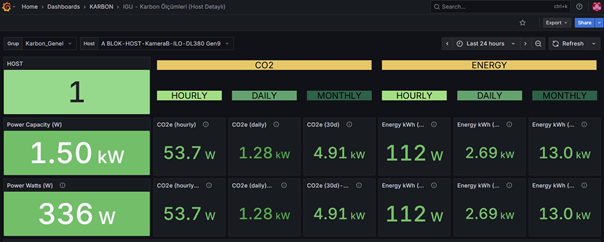
Image 1. Carbon Emission and Energy Monitoring Interface (Pilot Application – 2024)